Data source and application management
Data source
Where does the data come from?
Energy Logserver is a solution allowing effective data processing from the IT environment that exists in the organization.
The Elsasticsearch engine allows building a database in witch large amounts of data are stored in ordered indexes. The Logstash module is responsible for load data into Indexes, whose function is to collect data on specific tcp/udp ports, filter them, normalize them and place them in the appropriate index. Additional plugins, that we can use in Logstash reinforce the work of the module, increase its efficiency, enabling the module to quick interpret data and parse it.
Below is an example of several of the many available Logstash plugins:
exec - receive output of the shell function as an event;
imap - read email from IMAP servers;
jdbc - create events based on JDC data;
jms - create events from Jms broker;
Both Elasticsearch and Logstash are free Open-Source solutions.
More information about Elasticsearch module can be find at: https://github.com/elastic/elasticsearch
List of available Logstash plugins: https://github.com/elastic/logstash-docs/tree/master/docs/plugins
System services
For proper operation Energy Logserver requires starting the following system services:
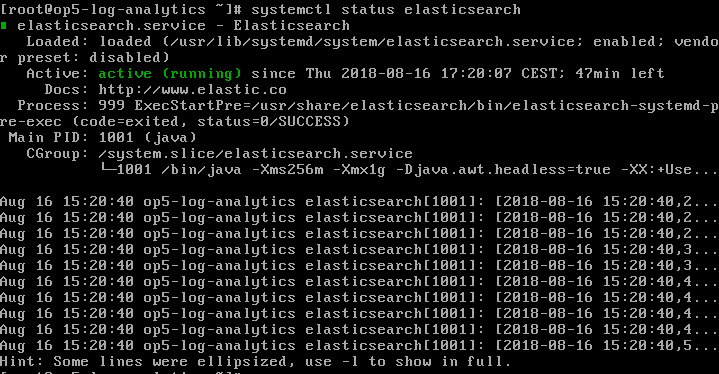
elasticsearch.service - we can run it with a command:
systemctl start elasticsearch.service
we can check its status with a command:
systemctl status elasticsearch.service
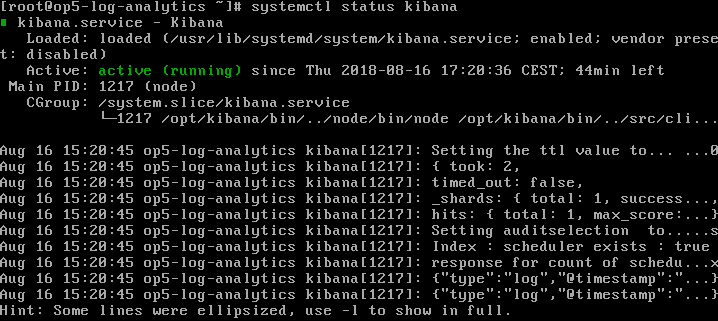
kibana.service - we can run it with a command:
systemctl start kibana.service
we can check its status with a command:
systemctl status kibana.service
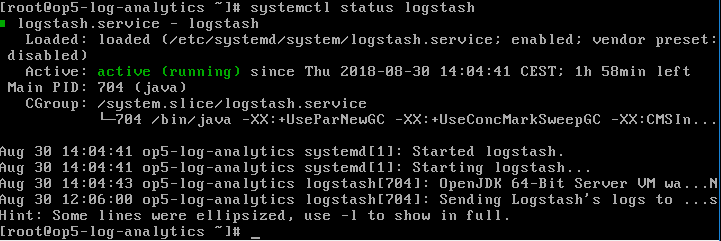
logstash.service - we can run it with a command:
systemctl start logstash.service
we can check its status with a command:
systemctl status logstash.service
First configuration steps
Run the instalation
To install and configure Energy Logserver on the CentOS Linux system you should:
copy archive Energy Logserver tar.bz2 to the hosted server;
extract archive Energy Logserver tar.bz2 contain application:
cd /root/ tar xvfj archive.tar.bz2
go to the application directory and run installation script as a root user:
  cd /root/insatll
  ./install.sh
Installation steps
During installation you will be ask about following tasks:
- add firewall exception on ports 22(ssh), 5044, 5514 (Logstash), 5601 (Kibana), 9200 (Elastisearch), 9300 (ES cross-JVM);
- installation of Java environment (Open-JDK), if you use your own Java environment - answer “N”;
- installation of Logstash application;
- configuration of Logstash with custom Energy Logserver configuration;
- connect to the Energy Logserver CentOS repository, which provides Python libraries, and some fonts;
- installation of Kibana, the Energy Logserver GUI;
- installation of Python dependencies;
- installation of mail components for Energy Logserver notification;
- installation of data-node of Elasticsearch;
- configuration of Elasticsearch as Data Node;
- configuration of Elasticsearch as Master Node.
Optional installation steps:
Optionally you can:
install and configure the filebeat agent;
install and configure the winlogbeat agent;
configure Energy Logserver perf_data to integrated with the Energy Logserver Monitor;
configure naemonLogs to integrated with the Naemon;
configure integration with Active Directory and SSO servers. You can find necessary information in 12-00-00-Integration_with_AD and 13-00-00-Windows-SSO;
install and configure monitoring with Marvel:
  cd /usr/share/elasticsearch
  sudo bin/plugin install license
  sudo bin/plugin install marvel-agent
  systemctl restart elasticsearch
enable predictive functionality in Intelligence module:
  curl -XPOST 'http://localhost:9200/_aliases' -d '{
   		"actions" : [
       	{ "add" : { "index" : "intelligence", "alias" : "predictive" } },
      	 { "add" : { "index" : "perfdata-linux", "alias" : "predictive" } }
   		]}'
generate writeback index for Alert service:
*/opt/alert/bin/elastalert-create-index --config /opt/alert/config.yaml*
First login
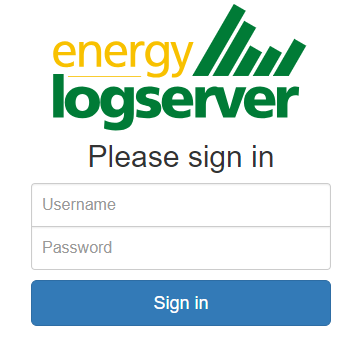
If you log in to Energy Logserver for the first time, you must specify the Index to be searched. We have the option of entering the name of your index, indicate a specific index from a given day, or using the asterix (*) to indicate all of them matching a specific index pattern. Therefore, to start working with Energy Logserver application, we log in to it (by default the user: logserver/password:logserver).
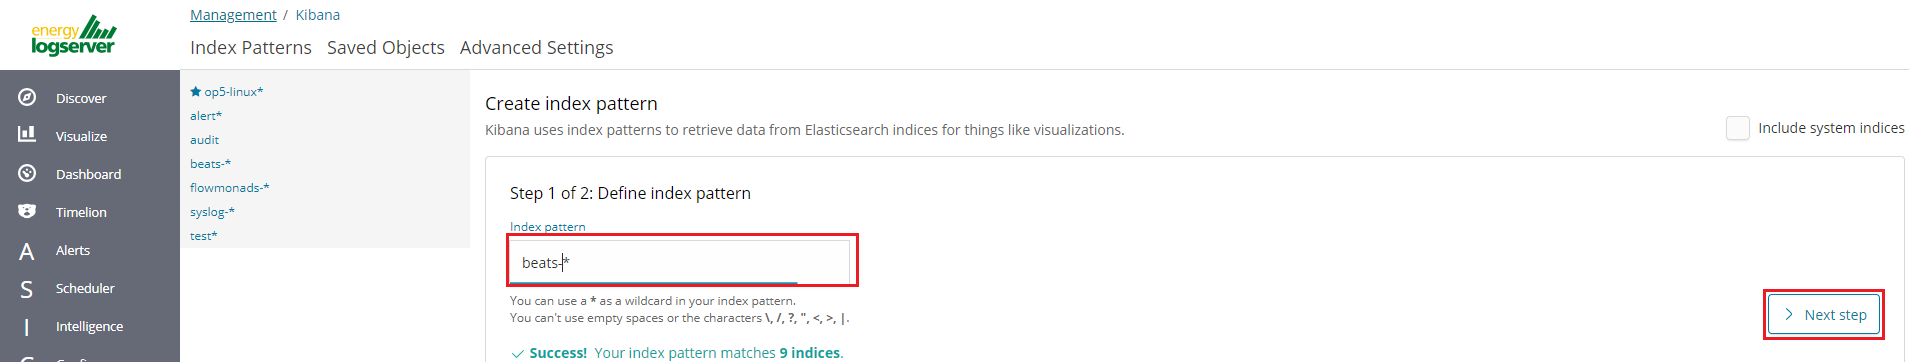
After logging in to the application click the button “Set up index pattern” to add new index patter in Kibana:

In the “Index pattern” field enter the name of the index or index pattern (after confirming that the index or sets of indexes exists) and click “Next step” button.
In the next step, from drop down menu select the “Time filter field name”, after witch individual event (events) should be sorter. By default the timestamp is set, which is the time of occurrence of the event, but depending of the preferences. It may also be the time of the indexing or other selected based on the fields indicate on the event.
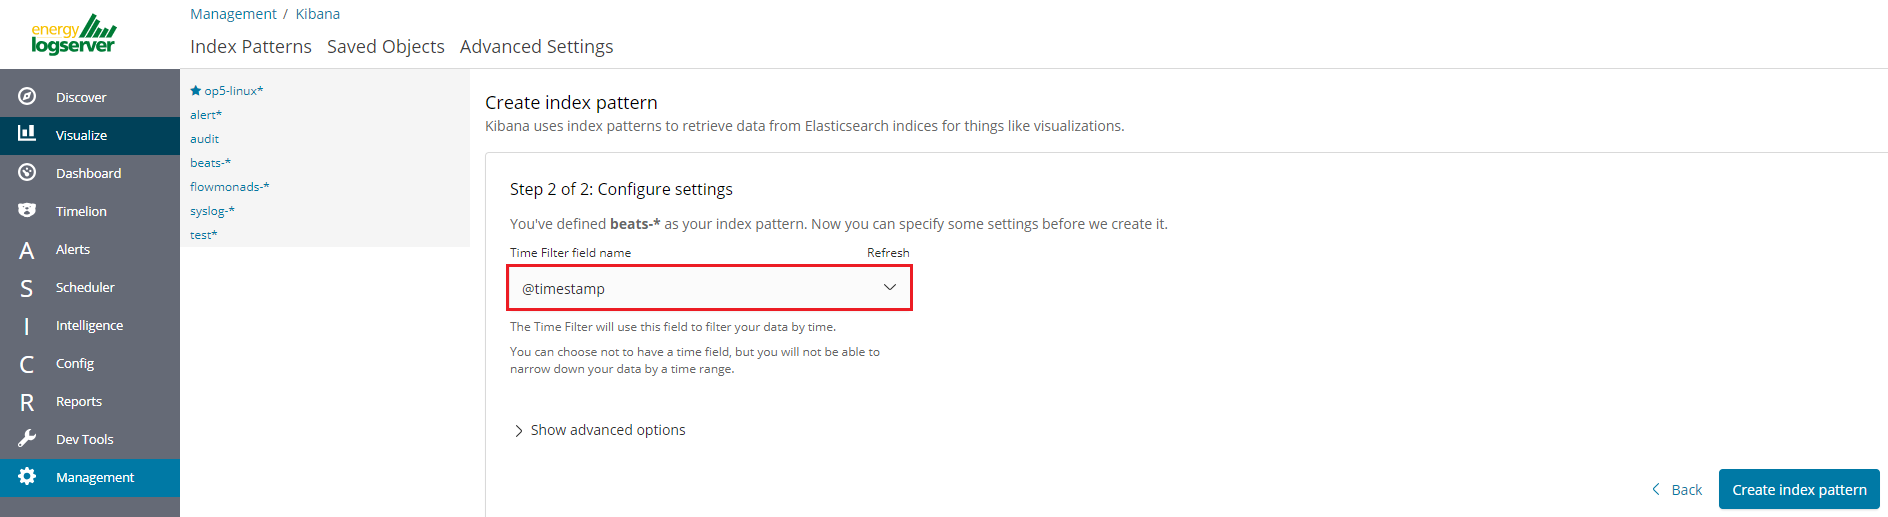
At any time, you can add more indexes or index patters by going to the main tab select „Management” and next select „Index Patterns”.
Index selection
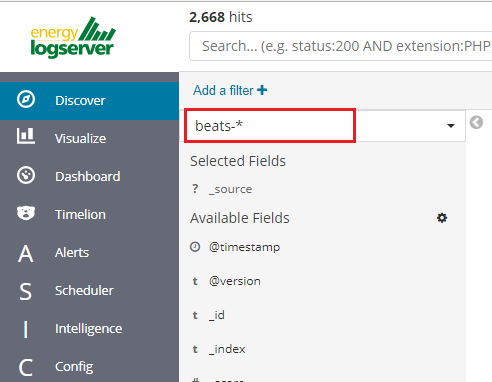
After login into Energy Logserver you will going to „Discover” tab, where you can interactively explore your data. You have access to every document in every index that matches the selected index patterns.
If you want to change selected index, drop down menu with the name of the current object in the left panel. Clicking on the object from the expanded list of previously create index patterns, will change the searched index.
Changing default users for services
Change Kibana User
Edit file /etc/systemd/system/kibana.service
	User=newuser
	Group= newuser
Edit /etc/default/kibana
	user=" newuser "
	group=" newuser "
Add appropriate permission:
chown newuser: /usr/share/kibana/ /etc/kibana/ -R
Change Elasticsearch User
Edit /usr/lib/tmpfiles.d/elasticsearch.conf and change user name and group:
d /var/run/elasticsearch 0755 newuser newuser –
Create directory:
mkdir /etc/systemd/system/elasticsearch.service.d/
Edit /etc/systemd/system/elasticsearch.service.d/01-user.conf
	[Service]
	User=newuser
	Group= newuser
Add appropriate permission:
chown -R newuser: /var/lib/elasticsearch /usr/share/elasticsearch /etc/elasticsearch /var/log/elasticsearch
Change Logstash User
Create directory:
mkdir /etc/systemd/system/logstash.service.d
Edit /etc/systemd/system/logstash.service.d/01-user.conf
	[Service]
	User=newuser
	Group=newuser
Add appropriate permission:
chown -R newuser: /etc/logstash /var/log/logstash
Custom installation the Energy Logserver
If you need to install Energy Logserver in non-default location, use the following steps.
Define the variable INSTALL_PATH if you do not want default paths like “/”
export INSTALL_PATH="/"
Install the firewalld service
yum install firewalld
Configure the firewalld service
 systemctl enable firewalld
 systemctl start firewalld
 firewall-cmd --zone=public --add-port=22/tcp --permanent
 firewall-cmd --zone=public --add-port=443/tcp --permanent
 firewall-cmd --zone=public --add-port=5601/tcp --permanent
 firewall-cmd --zone=public --add-port=9200/tcp --permanent
 firewall-cmd --zone=public --add-port=9300/tcp --permanent
 firewall-cmd --reload
Install and enable the epel repository
yum install epel-release
Install the Java OpenJDK
yum install java-1.8.0-openjdk-headless.x86_64
Install the reports dependencies, e.g. for mail and fonts
yum install fontconfig freetype freetype-devel fontconfig-devel libstdc++ urw-fonts net-tools ImageMagick ghostscript poppler-utils
Create the nessesery users acounts
 useradd -M -d ${INSTALL_PATH}/usr/share/kibana -s /sbin/nologin kibana
 useradd -M -d ${INSTALL_PATH}/usr/share/elasticsearch -s /sbin/nologin elasticsearch
 useradd -M -d ${INSTALL_PATH}/opt/alert -s /sbin/nologin alert
Remove .gitkeep files from source directory
find . -name ".gitkeep" -delete
Install the Elasticsearch 6.2.4 files
/bin/cp -rf elasticsearch/elasticsearch-6.2.4/* ${INSTALL_PATH}/Install the Kibana 6.2.4 files
/bin/cp -rf kibana/kibana-6.2.4/* ${INSTALL_PATH}/Configure the Elasticsearch system dependencies
 /bin/cp -rf system/limits.d/30-elasticsearch.conf /etc/security/limits.d/
 /bin/cp -rf system/sysctl.d/90-elasticsearch.conf /etc/sysctl.d/
 /bin/cp -rf system/sysconfig/elasticsearch /etc/sysconfig/
 /bin/cp -rf system/rsyslog.d/intelligence.conf /etc/rsyslog.d/
 echo -e "RateLimitInterval=0\nRateLimitBurst=0" >> /etc/systemd/journald.conf
 systemctl daemon-reload
 systemctl restart rsyslog.service
 sysctl -p /etc/sysctl.d/90-elasticsearch.conf
Configure the SSL Encryption for the Kibana
 mkdir -p ${INSTALL_PATH}/etc/kibana/ssl
 openssl req -x509 -nodes -days 365 -newkey rsa:2048 -sha256 -subj '/CN=LOGSERVER/subjectAltName=LOGSERVER/' -keyout ${INSTALL_PATH}/etc/kibana/ssl/kibana.key -out ${INSTALL_PATH}/etc/kibana/ssl/kibana.crt
Install the Elasticsearch-auth plugin
cp -rf elasticsearch/elasticsearch-auth ${INSTALL_PATH}/usr/share/elasticsearch/plugins/elasticsearch-authInstall the Elasticsearh configuration files
/bin/cp -rf elasticsearch/*.yml ${INSTALL_PATH}/etc/elasticsearch/Install the Elasticsicsearch system indices
 mkdir -p ${INSTALL_PATH}/var/lib/elasticsearch
 /bin/cp -rf elasticsearch/nodes ${INSTALL_PATH}/var/lib/elasticsearch/
Add necessary permission for the Elasticsearch directories
chown -R elasticsearch:elasticsearch ${INSTALL_PATH}/usr/share/elasticsearch ${INSTALL_PATH}/etc/elasticsearch ${INSTALL_PATH}/var/lib/elasticsearch ${INSTALL_PATH}/var/log/elasticsearchInstall the Kibana plugins
cp -rf kibana/plugins/* ${INSTALL_PATH}/usr/share/kibana/plugins/Extrace the node_modules for plugins and remove archive
 tar -xf ${INSTALL_PATH}/usr/share/kibana/plugins/node_modules.tar -C ${INSTALL_PATH}/usr/share/kibana/plugins/
 /bin/rm -rf ${INSTALL_PATH}/usr/share/kibana/plugins/node_modules.tar
Install the Kibana reports binaries
cp -rf kibana/export_plugin/* ${INSTALL_PATH}/usr/share/kibana/bin/Create directory for the Kibana reports
/bin/cp -rf kibana/optimize ${INSTALL_PATH}/usr/share/kibana/Install the python dependencies for reports
tar -xf kibana/python.tar -C /usr/lib/python2.7/site-packages/
Install the Kibana custom sources
/bin/cp -rf kibana/src/* ${INSTALL_PATH}/usr/share/kibana/src/Install the Kibana configuration
/bin/cp -rf kibana/kibana.yml ${INSTALL_PATH}/etc/kibana/kibana.ymlGenerate the iron secret salt for Kibana
echo "server.ironsecret: \"$(</dev/urandom tr -dc _A-Z-a-z-0-9 | head -c32)\"" >> ${INSTALL_PATH}/etc/kibana/kibana.ymlRemove old cache files
rm -rf ${INSTALL_PATH}/usr/share/kibana/optimize/bundles/*Install the Alert plugin
 mkdir -p ${INSTALL_PATH}/opt
 /bin/cp -rf alert ${INSTALL_PATH}/opt/alert
Install the AI plugin
/bin/cp -rf ai ${INSTALL_PATH}/opt/aiSet the proper permissions
 chown -R elasticsearch:elasticsearch ${INSTALL_PATH}/usr/share/elasticsearch/
 chown -R alert:alert ${INSTALL_PATH}/opt/alert
 chown -R kibana:kibana ${INSTALL_PATH}/usr/share/kibana ${INSTALL_PATH}/opt/ai ${INSTALL_PATH}/opt/alert/rules ${INSTALL_PATH}/var/lib/kibana
 chmod -R 755 ${INSTALL_PATH}/opt/ai
 chmod -R 755 ${INSTALL_PATH}/opt/alert
Install service files for the Alert, Kibana and the Elasticsearch
 /bin/cp -rf system/alert.service /usr/lib/systemd/system/alert.service
 /bin/cp -rf kibana/kibana-6.2.4/etc/systemd/system/kibana.service /usr/lib/systemd/system/kibana.service
 /bin/cp -rf elasticsearch/elasticsearch-6.2.4/usr/lib/systemd/system/elasticsearch.service /usr/lib/systemd/system/elasticsearch.service
Set property paths in service files ${INSTALL_PATH}
 perl -pi -e 's#/opt#'${INSTALL_PATH}'/opt#g' /usr/lib/systemd/system/alert.service
 perl -pi -e 's#/etc#'${INSTALL_PATH}'/etc#g' /usr/lib/systemd/system/kibana.service
 perl -pi -e 's#/usr#'${INSTALL_PATH}'/usr#g' /usr/lib/systemd/system/kibana.service
 perl -pi -e 's#ES_HOME=#ES_HOME='${INSTALL_PATH}'#g' /usr/lib/systemd/system/elasticsearch.service
 perl -pi -e 's#ES_PATH_CONF=#ES_PATH_CONF='${INSTALL_PATH}'#g' /usr/lib/systemd/system/elasticsearch.service
 perl -pi -e 's#ExecStart=#ExecStart='${INSTALL_PATH}'#g' /usr/lib/systemd/system/elasticsearch.service
Enable the system services
 systemctl daemon-reload
 systemctl reenable alert
 systemctl reenable kibana
 systemctl reenable elasticsearch
Set location for Elasticsearch data and logs files in configuration file
Elasticsearch
  perl -pi -e 's#path.data: #path.data: '${INSTALL_PATH}'#g' ${INSTALL_PATH}/etc/elasticsearch/elasticsearch.yml
  perl -pi -e 's#path.logs: #path.logs: '${INSTALL_PATH}'#g' ${INSTALL_PATH}/etc/elasticsearch/elasticsearch.yml
  perl -pi -e 's#/usr#'${INSTALL_PATH}'/usr#g' ${INSTALL_PATH}/etc/elasticsearch/jvm.options
  perl -pi -e 's#/usr#'${INSTALL_PATH}'/usr#g' /etc/sysconfig/elasticsearch
Kibana
  perl -pi -e 's#/etc#'${INSTALL_PATH}'/etc#g' ${INSTALL_PATH}/etc/kibana/kibana.yml
  perl -pi -e 's#/opt#'${INSTALL_PATH}'/opt#g' ${INSTALL_PATH}/etc/kibana/kibana.yml
  perl -pi -e 's#/usr#'${INSTALL_PATH}'/usr#g' ${INSTALL_PATH}/etc/kibana/kibana.yml
AI
perl -pi -e 's#/opt#'${INSTALL_PATH}'/opt#g' ${INSTALL_PATH}/opt/ai/bin/conf.cfg
What next ?
Upload License file to ${INSTALL_PATH}/usr/share/elasticsearch/directory.
Setup cluster in ${INSTALL_PATH}/etc/elasticsearch/elasticsearch.yml
discovery.zen.ping.unicast.hosts: [ "172.10.0.1:9300", "172.10.0.2:9300" ]
Redirect GUI to 443/tcp
  	firewall-cmd --zone=public --add-masquerade --permanent
  	firewall-cmd --zone=public --add-forward-port=port=443:proto=tcp:toport=5601 --permanent
  	firewall-cmd --reload
Plugins management in the Elasticsearch
Base installation of the Energy Logserver contains the elasticsearch-auth plugin. You can extend the basic Elasticsearch functionality by installing the custom plugins.
Plugins contain JAR files, but may also contain scripts and config files, and must be installed on every node in the cluster.
After installation, each node must be restarted before the plugin becomes visible.
The Elasticsearch provides two categories of plugins:
- Core Plugins - it is plugins that are part of the Elasticsearch project.
- Community contributed - it is plugins that are external to the Elasticsearch project
Installing Plugins
Core Elasticsearch plugins can be installed as follows:
cd /usr/share/elasticsearch/
bin/elasticsearch-plugin install [plugin_name]
Example:
bin/elasticsearch-plugin install ingest-geoip

-> Downloading ingest-geoip from elastic
[=================================================] 100%
@@@@@@@@@@@@@@@@@@@@@@@@@@@@@@@@@@@@@@@@@@@@@@@@@@@@@@@@@@@
@ WARNING: plugin requires additional permissions @
@@@@@@@@@@@@@@@@@@@@@@@@@@@@@@@@@@@@@@@@@@@@@@@@@@@@@@@@@@@
* java.lang.RuntimePermission accessDeclaredMembers
* java.lang.reflect.ReflectPermission suppressAccessChecks
See http://docs.oracle.com/javase/8/docs/technotes/guides/security/permissions.html
for descriptions of what these permissions allow and the associated risks.

Continue with installation? [y/N]y
-> Installed ingest-geoip
Plugins from custom link or filesystem can be installed as follow:
cd /usr/share/elasticsearch/
sudo bin/elasticsearch-plugin install [url]
Example:
sudo bin/elasticsearch-plugin install file:///path/to/plugin.zip
bin\elasticsearch-plugin install file:///C:/path/to/plugin.zip
sudo bin/elasticsearch-plugin install http://some.domain/path/to/plugin.zip
Listing plugins
Listing currently loaded plugins
sudo bin/elasticsearch-plugin list
listing currently available core plugins:
sudo bin/elasticsearch-plugin list --help
Removing plugins
sudo bin/elasticsearch-plugin remove [pluginname]
Updating plugins
sudo bin/elasticsearch-plugin remove [pluginname]
sudo bin/elasticsearch-plugin install [pluginname]
ROOTless management
To configure Energy Logserver so its services can be managed without root access follow these steps:
Create a file in
/etc/sudoers.d(eg.: 10-logserver) with the content%kibana ALL=/bin/systemctl status kibana %kibana ALL=/bin/systemctl status kibana.service %kibana ALL=/bin/systemctl stop kibana %kibana ALL=/bin/systemctl stop kibana.service %kibana ALL=/bin/systemctl start kibana %kibana ALL=/bin/systemctl start kibana.service %kibana ALL=/bin/systemctl restart kibana %kibana ALL=/bin/systemctl restart kibana.service %elasticsearch ALL=/bin/systemctl status elasticsearch %elasticsearch ALL=/bin/systemctl status elasticsearch.service %elasticsearch ALL=/bin/systemctl stop elasticsearch %elasticsearch ALL=/bin/systemctl stop elasticsearch.service %elasticsearch ALL=/bin/systemctl start elasticsearch %elasticsearch ALL=/bin/systemctl start elasticsearch.service %elasticsearch ALL=/bin/systemctl restart elasticsearch %elasticsearch ALL=/bin/systemctl restart elasticsearch.service %alert ALL=/bin/systemctl status alert %alert ALL=/bin/systemctl status alert.service %alert ALL=/bin/systemctl stop alert %alert ALL=/bin/systemctl stop alert.service %alert ALL=/bin/systemctl start alert %alert ALL=/bin/systemctl start alert.service %alert ALL=/bin/systemctl restart alert %alert ALL=/bin/systemctl restart alert.service %logstash ALL=/bin/systemctl status logstash %logstash ALL=/bin/systemctl status logstash.service %logstash ALL=/bin/systemctl stop logstash %logstash ALL=/bin/systemctl stop logstash.service %logstash ALL=/bin/systemctl start logstash %logstash ALL=/bin/systemctl start logstash.service %logstash ALL=/bin/systemctl restart logstash %logstash ALL=/bin/systemctl restart logstash.service
Change permissions for files and directories
Kibana, Elasticsearch, Alert
chmod g+rw /etc/kibana/kibana.yml /opt/alert/config.yaml /opt/ai/bin/conf.cfg /etc/elasticsearch/{elasticsearch.yml,jvm.options,log4j2.properties,properties.yml,role-mappings.yml}
	chmod g+rwx /etc/kibana/ssl /etc/elasticsearch/ /opt/{ai,alert} /opt/ai/bin
	chown -R elasticsearch:elasticsearch /etc/elasticsearch/
	chown -R kibana:kibana /etc/kibana/ssl
Logstash
```bash
find /etc/logstash -type f -exec chmod g+rw {} ; find /etc/logstash -type d -exec chmod g+rwx {} ; chown -R logstash:logstash /etc/logstash
Add a user to groups defined earlier
usermod -a -G kibana,alert,elasticsearch,logstash service_user
From now on this user should be able to start/stop/restart services and modify configurations files.
Energy Logserver Elasticsearch encryption
Generating Certificates
- Requirements for certificate configuration:
- To encrypt traffic (HTTP and transport layer) of Elasticsearch you have to generate certificate authority which will be used to sign each node certificate of a cluster.
- Elasticsearch certificate has to be generated in pkcs8 RSA format.
- Example certificate configuration (Certificates will be valid for 10 years based on this example):
# To make this process easier prepare some variables:
DOMAIN=loganalytics-node.test
DOMAIN_IP=10.4.3.185 # This is required if certificate validation is used on trasport layer
COUNTRYNAME=PL
STATE=Poland
COMPANY=LOGTEST

# Generate CA key:
openssl genrsa -out rootCA.key 4096

# Create and sign root certificate:
echo -e "${COUNTRYNAME}\n${STATE}\n\n${COMPANY}\n\n\n\n" | openssl req -x509 -new -nodes -key rootCA.key -sha256 -days 3650 -out rootCA.crt

# Crete RSA key for domain:
openssl genrsa -out ${DOMAIN}.pre 2048

# Convert generated key to pkcs8 RSA key for domain hostname
# (if you do not want to encrypt the key add "-nocrypt" at the end of the command; otherwise it will be necessary to add this password later in every config file):
openssl pkcs8 -topk8 -inform pem -in ${DOMAIN}.pre -outform pem -out ${DOMAIN}.key

# Create a Certificate Signing Request (openssl.cnf can be in a different location; this is the default for CentOS 7.7):
openssl req -new -sha256 -key ${DOMAIN}.key -subj "/C=PL/ST=Poland/O=EMCA/CN=${DOMAIN}" -reqexts SAN -config <(cat /etc/pki/tls/openssl.cnf <(printf "[SAN]\nsubjectAltName=DNS:${DOMAIN},IP:${DOMAIN_IP}")) -out ${DOMAIN}.csr

# Generate Domain Certificate
openssl x509 -req -in ${DOMAIN}.csr -CA rootCA.crt -CAkey rootCA.key -CAcreateserial -out ${DOMAIN}.crt -sha256 -extfile <(printf "[req]\ndefault_bits=2048\ndistinguished_name=req_distinguished_name\nreq_extensions=req_ext\n[req_distinguished_name]\ncountryName=${COUNTRYNAME}\nstateOrProvinceName=${STATE}\norganizationName=${COMPANY}\ncommonName=${DOMAIN}\n[req_ext]\nsubjectAltName=@alt_names\n[alt_names]\nDNS.1=${DOMAIN}\nIP=${DOMAIN_IP}\n") -days 3650 -extensions req_ext

# Verify the validity of the generated certificate
openssl x509 -in ${DOMAIN}.crt -text -noout
- Right now you should have these files:
$ ls -1 | sort
loganalytics-node.test.crt
loganalytics-node.test.csr
loganalytics-node.test.key
loganalytics-node.test.pre
rootCA.crt
rootCA.key
rootCA.srl
- Create a directory to store required files (users: elasticsearch, kibana and logstash have to be able to read these files):
mkdir /etc/elasticsearch/ssl
cp {loganalytics-node.test.crt,loganalytics-node.test.key,rootCA.crt} /etc/elasticsearch/ssl
chown -R elasticsearch:elasticsearch /etc/elasticsearch/ssl
chmod 755 /etc/elasticsearch/ssl
chmod 644 /etc/elasticsearch/ssl/*
Setting up configuration files
- Append or uncomment below lines in
/etc/elasticsearch/elasticsearch.ymland change paths to proper values (based on past steps):
## Transport layer encryption
logserverguard.ssl.transport.enabled: true
logserverguard.ssl.transport.pemcert_filepath: "/etc/elasticsearch/ssl/loganalytics-node.test.crt"
logserverguard.ssl.transport.pemkey_filepath: "/etc/elasticsearch/ssl/loganalytics-node.test.key"
logserverguard.ssl.transport.pemkey_password: "password_for_pemkey" # if there is no password leve ""
logserverguard.ssl.transport.pemtrustedcas_filepath: "/etc/elasticsearch/ssl/rootCA.crt"

logserverguard.ssl.transport.enforce_hostname_verification: true
logserverguard.ssl.transport.resolve_hostname: true

logserverguard.ssl.transport.enabled_ciphers:
 - "TLS_DHE_RSA_WITH_AES_256_GCM_SHA384"
logserverguard.ssl.transport.enabled_protocols:
 - "TLSv1.2"

## HTTP layer encryption
logserverguard.ssl.http.enabled: true
logserverguard.ssl.http.pemcert_filepath: "/etc/elasticsearch/ssl/loganalytics-node.test.crt"
logserverguard.ssl.http.pemkey_filepath: "/etc/elasticsearch/ssl/loganalytics-node.test.key"
logserverguard.ssl.http.pemkey_password: "password_for_pemkey" # if there is no password leve ""
logserverguard.ssl.http.pemtrustedcas_filepath: "/etc/elasticsearch/ssl/rootCA.crt"

logserverguard.ssl.http.clientauth_mode: OPTIONAL
logserverguard.ssl.http.enabled_ciphers:
 - "TLS_DHE_RSA_WITH_AES_256_GCM_SHA384"

logserverguard.ssl.http.enabled_protocols:
 - "TLSv1.2"
- Append or uncomment below lines in
/etc/kibana/kibana.ymland change paths to proper values:
# For below two, both IP or HOSTNAME (https://loganalytics-node.test:PORT) can be used because IP has been supplied in "alt_names"
elasticsearch.url: "https://10.4.3.185:8000" # Default is "http://localhost:8000"
---
elastfilter.url: "https://10.4.3.185:9200" # Default is"http://localhost:9200"
---
# Elasticsearch trafic encryption
# There is also an option to use "127.0.0.1/localhost" and to not supply path to CA. Verification Mode should be then changed to "none".
elasticsearch.ssl.verificationMode: full
elasticsearch.ssl.certificate: "/etc/elasticsearch/ssl/loganalytics-node.test.crt"
elasticsearch.ssl.key: "/etc/elasticsearch/ssl/loganalytics-node.test.key"
elasticsearch.ssl.keyPassphrase: "password_for_pemkey" # this line is not required if there is no password
elasticsearch.ssl.certificateAuthorities: "/etc/elasticsearch/ssl/rootCA.crt"
- Append or uncomment below lines in
/opt/alert/config.yamland change paths to proper values:
# Connect with TLS to Elasticsearch
use_ssl: True

# Verify TLS certificates
verify_certs: True

# Client certificate:
client_cert: /etc/elasticsearch/ssl/loganalytics-node.test.crt
client_key: /etc/elasticsearch/ssl/loganalytics-node.test.key
ca_certs: /etc/elasticsearch/ssl/rootCA.crt
- For CSV/HTML export to work properly rootCA.crt generated in first step has to be “installed” on the server. Below example for CentOS 7:
# Copy rootCA.crt and update CA trust store
cp /etc/elasticsearch/ssl/rootCA.crt /etc/pki/ca-trust/source/anchors/rootCA.crt
update-ca-trust
- Intelligence module. Generate pkcs12 keystore/cert:
DOMAIN=loganalytics-node.test
keytool -import -file /etc/elasticsearch/ssl/rootCA.crt -alias root -keystore root.jks
openssl pkcs12 -export -in /etc/elasticsearch/ssl/${DOMAIN}.crt -inkey /etc/elasticsearch/ssl/${DOMAIN}.key -out ${DOMAIN}.p12 -name "${DOMAIN}" -certfile /etc/elasticsearch/ssl/rootCA.crt
# Configure /opt/ai/bin/conf.cfg
https_keystore=/path/to/pk12/loganalytics-node.test.p12
https_truststore=/path/to/root.jks
https_keystore_pass=bla123
https_truststore_pass=bla123
Logstash/Beats
You can eather install CA to allow Logstash and Beats traffic or you can supply required certificates in config:
- Logstash:
output {
  elasticsearch {
    hosts => "https://loganalytics-node.test:9200"
    ssl => true
    index => "winlogbeat-%{+YYYY.MM}"
    user => "logstash"
    password => "logstash"
    cacert => "/path/to/cacert/rootCA.crt"
  }
}
- Beats:
output.elasticsearch.hosts: ["https://loganalytics-node.test:9200"]
output.elasticsearch.protocol: "https"
output.elasticsearch.ssl.enabled: true
output.elasticsearch.ssl.certificate_authorities: ["/path/to/cacert/rootCA.crt"]
Additionally, for any beats program to be able to write to elasticsearch, you will have to make changes to “enabled_ciphers” directive in “/etc/elasticsearch/elasticsearch.yml”. This is done by commenting:
logserverguard.ssl.http.enabled_ciphers:
 - "TLS_DHE_RSA_WITH_AES_256_GCM_SHA384"
Otherwise, the beat will not be able to send documents directly and if you want to avoid it you can send a document with Logstash first.